In the realm of data analysis and machine learning, the Pandas library stands as a powerful tool. With more than 200 functions and methods, it makes you capable of wrangling and transforming data and it also makes you incapable of wrangling and transforming data because of its complexities. A dual-edge sword it is.
Therefore, we will explore Panda’s most common yet useful functions and methods. Knowing this will bring you ahead of other beginners learning Pandas.
We will utilize a pseudo-dataset in the whole course of this paper.
The first step is to import pandas as pd. This is one of the best practices to import pandas, as pd is a well-known abbreviation for pandas.
import pandas as pd
Importing Your Data
Before any data manipulation, you need to import your data. The read_csv() function is your entry point to loading datasets into Pandas DataFrames. By specifying the file path, this function brings data to life, enabling you to begin your data exploration and analysis.
To import, follow this syntax and input your dataset file path.
In[*]  car_sales = pd.read_csv("./data/car-sales.csv")
       car_sales

Output
A Glimpse into Your Data
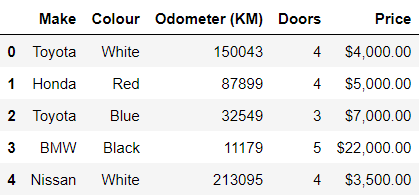
Curious about the first or last few rows of your DataFrame? head() and tail() provides a quick peek, helping you assess the structure and content of your dataset. Ideal for a preliminary understanding before diving into data transformations. You can input an argument inside head(9) and tail(9) to specify how many items you would like to see. The default is 5 items.
To illustrate, see the example code input and output below.
In[*] car_sales.head()

Output
In[*] car_sales.tail()

Output
Know Your Data Inside Out
The info() function is your data detective. It delivers a comprehensive summary of your DataFrame, showcasing the number of non-null entries, data types, memory usage, and more. This quick overview can guide your data cleaning and preparation efforts.
In[*] car_sales.info()

Output
Uncover Descriptive Statistics
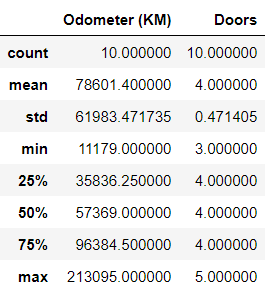
Statistical insights are just a function away. The describe() function delivers a plethora of descriptive statistics, including mean, median, min, max, and quartiles. Gain a snapshot of your numerical data's distribution and spot potential outliers. Remember that describe() may not show meaningful information, it will always depend on your datasets.
In[*] car_sales.describe()

Output
Grouping Your Way to Insights
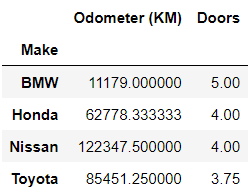
Data often tells a richer story when grouped by specific attributes. The groupby() function allows you to segment data based on a particular column, making it an essential tool for aggregating, summarizing, and visualizing trends within your dataset.
In[*] car_sales.groupby(["Make"]).mean()

Output
Empowering Custom Transformations
Sometimes, off-the-shelf functions aren’t enough. The apply() function grants you the freedom to apply custom functions to your data. This flexibility opens doors to tailored data transformations that cater to your specific needs. This is also important in manipulating and cleaning your datasets.
In this example, we are going to apply lambda function to remove $ , , and .00 in the Prices and convert it to int to perform meaningful functions. See the BEFORE and AFTER of Prices.
In[*]  car_sales["Price"] = car_sales["Price"].apply (lambda x: x.replace(".00", '')).str.replace('[\$\,]', '').astype(int)
       car_sales

BEFORE

AFTER
Tackling Missing Data
Dealing with missing data is a common challenge. The fillna() function allows you to replace missing values, while dropna() lets you remove rows or columns with missing data. These functions ensure your analysis is based on complete and accurate information.
To illustrate, let us import a new dataset with missing data.
In[*]  car_sales_missing = pd.read_csv("./data/car-sales-missing-data.csv")
       car_sales_missing

Output
We can clearly see that some of the data of Odometer has a value of NaN, with this, let us use fillna() and fill the missing value with the mean of Odometer.
In[*] car_sales_missing["Odometer"] = car_sales_missing["Odometer"].fillna(car_sales_missing["Odometer"].mean())

Output
Now, Colours, Doors, and Price are the only ones with NaN, located in indexes 6, 7, 8, and 9 respectively. We will drop the rows and columns that contain NaN using dropna().
In[*]  car_sales_missing = car_sales_missing.dropna()
       car_sales_missing

Output
Pandas is more than just a library; it’s a gateway to effective data manipulation and analysis. Armed with these essential functions, you’re poised to tackle real-world data challenges and machine-learning problems with confidence. Whether you’re a data scientist, analyst, or machine learning engineer, Pandas empowers you to transform messy datasets into valuable insights. So, dive in, experiment, and unlock the boundless potential of Pandas for your data-driven endeavors.
Stay curious and keep your analytical mind stimulated!
If you want to explore more about Pandas, consider taking a look at their documentation!
